


Why wasting time doing tedious legwork?
Why not catching a coding mistake early before it's too late?
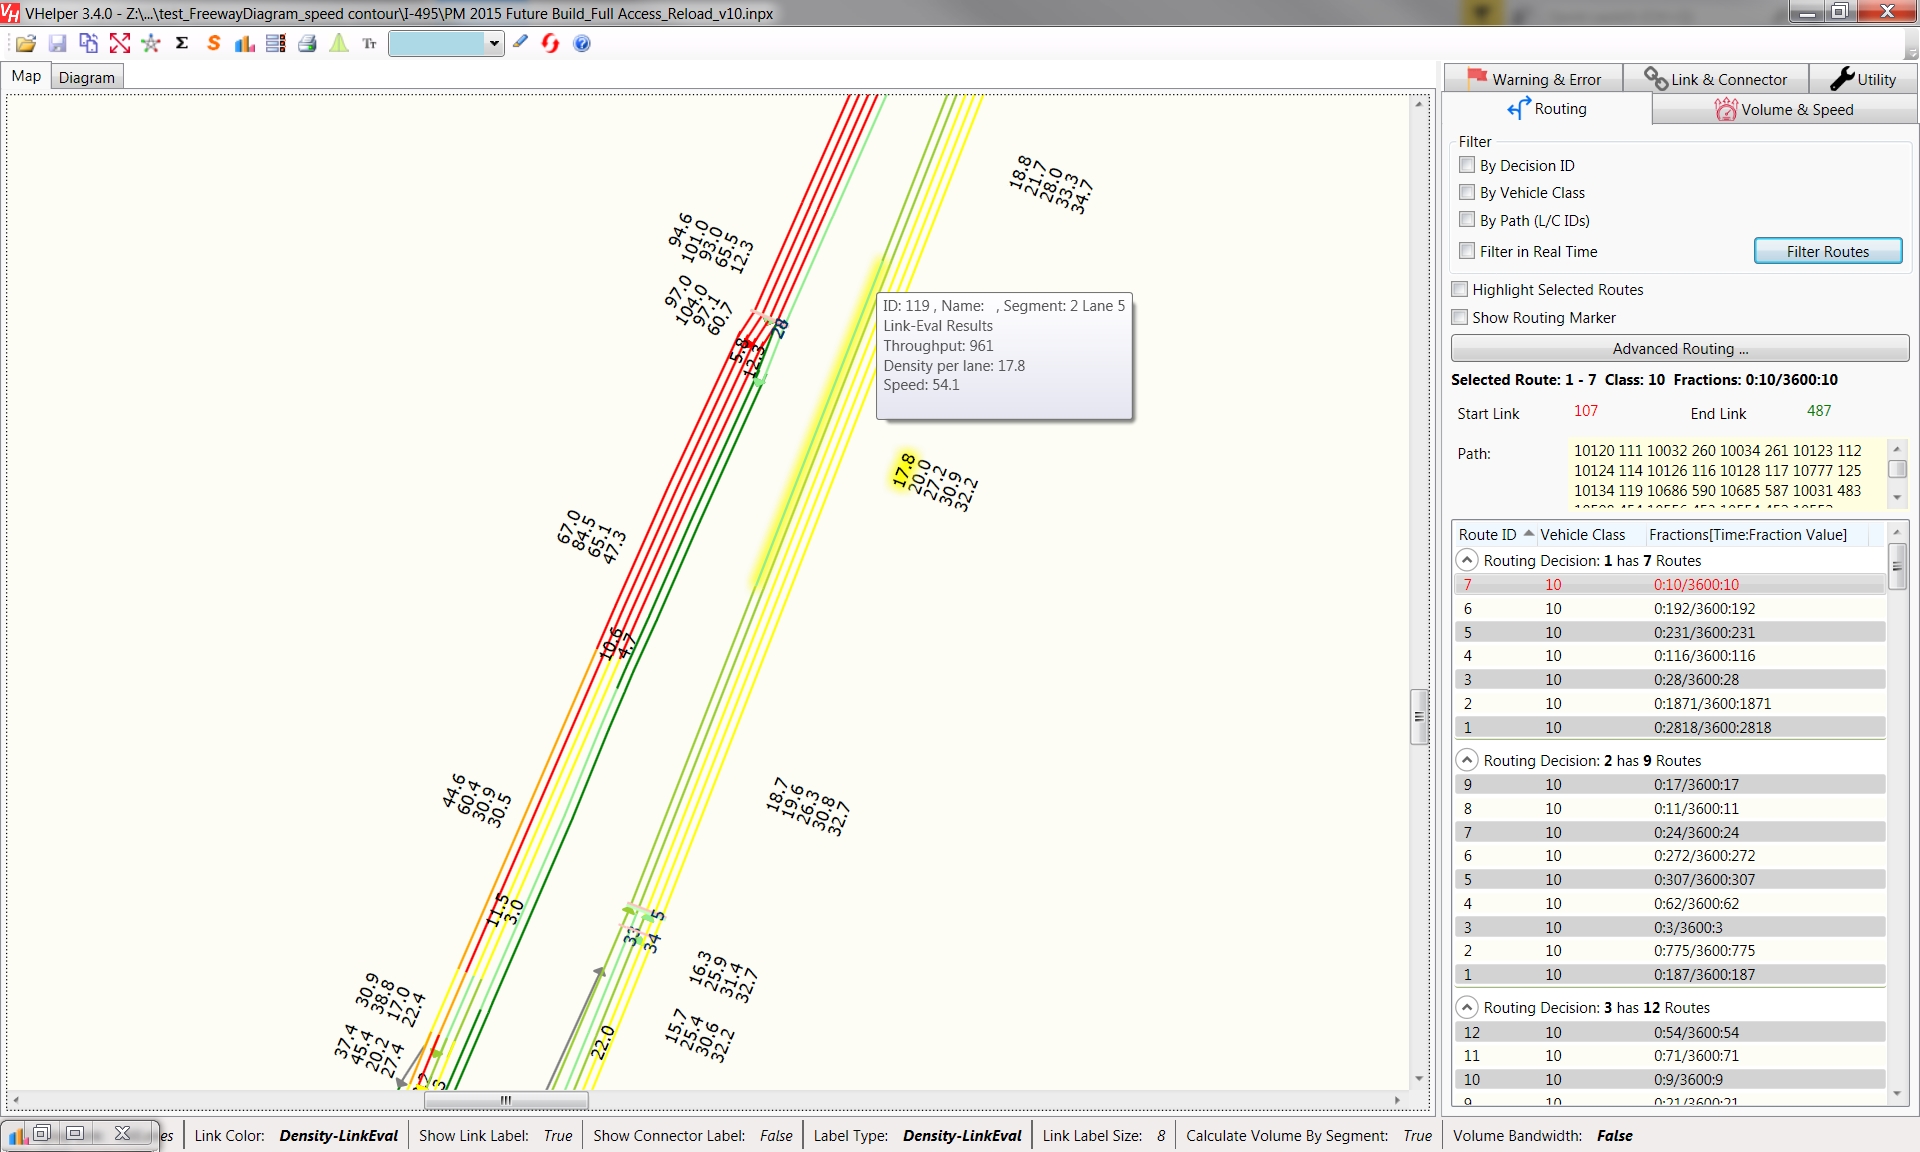
Why not getting a beautiful speed contour heat map by a few clicks?
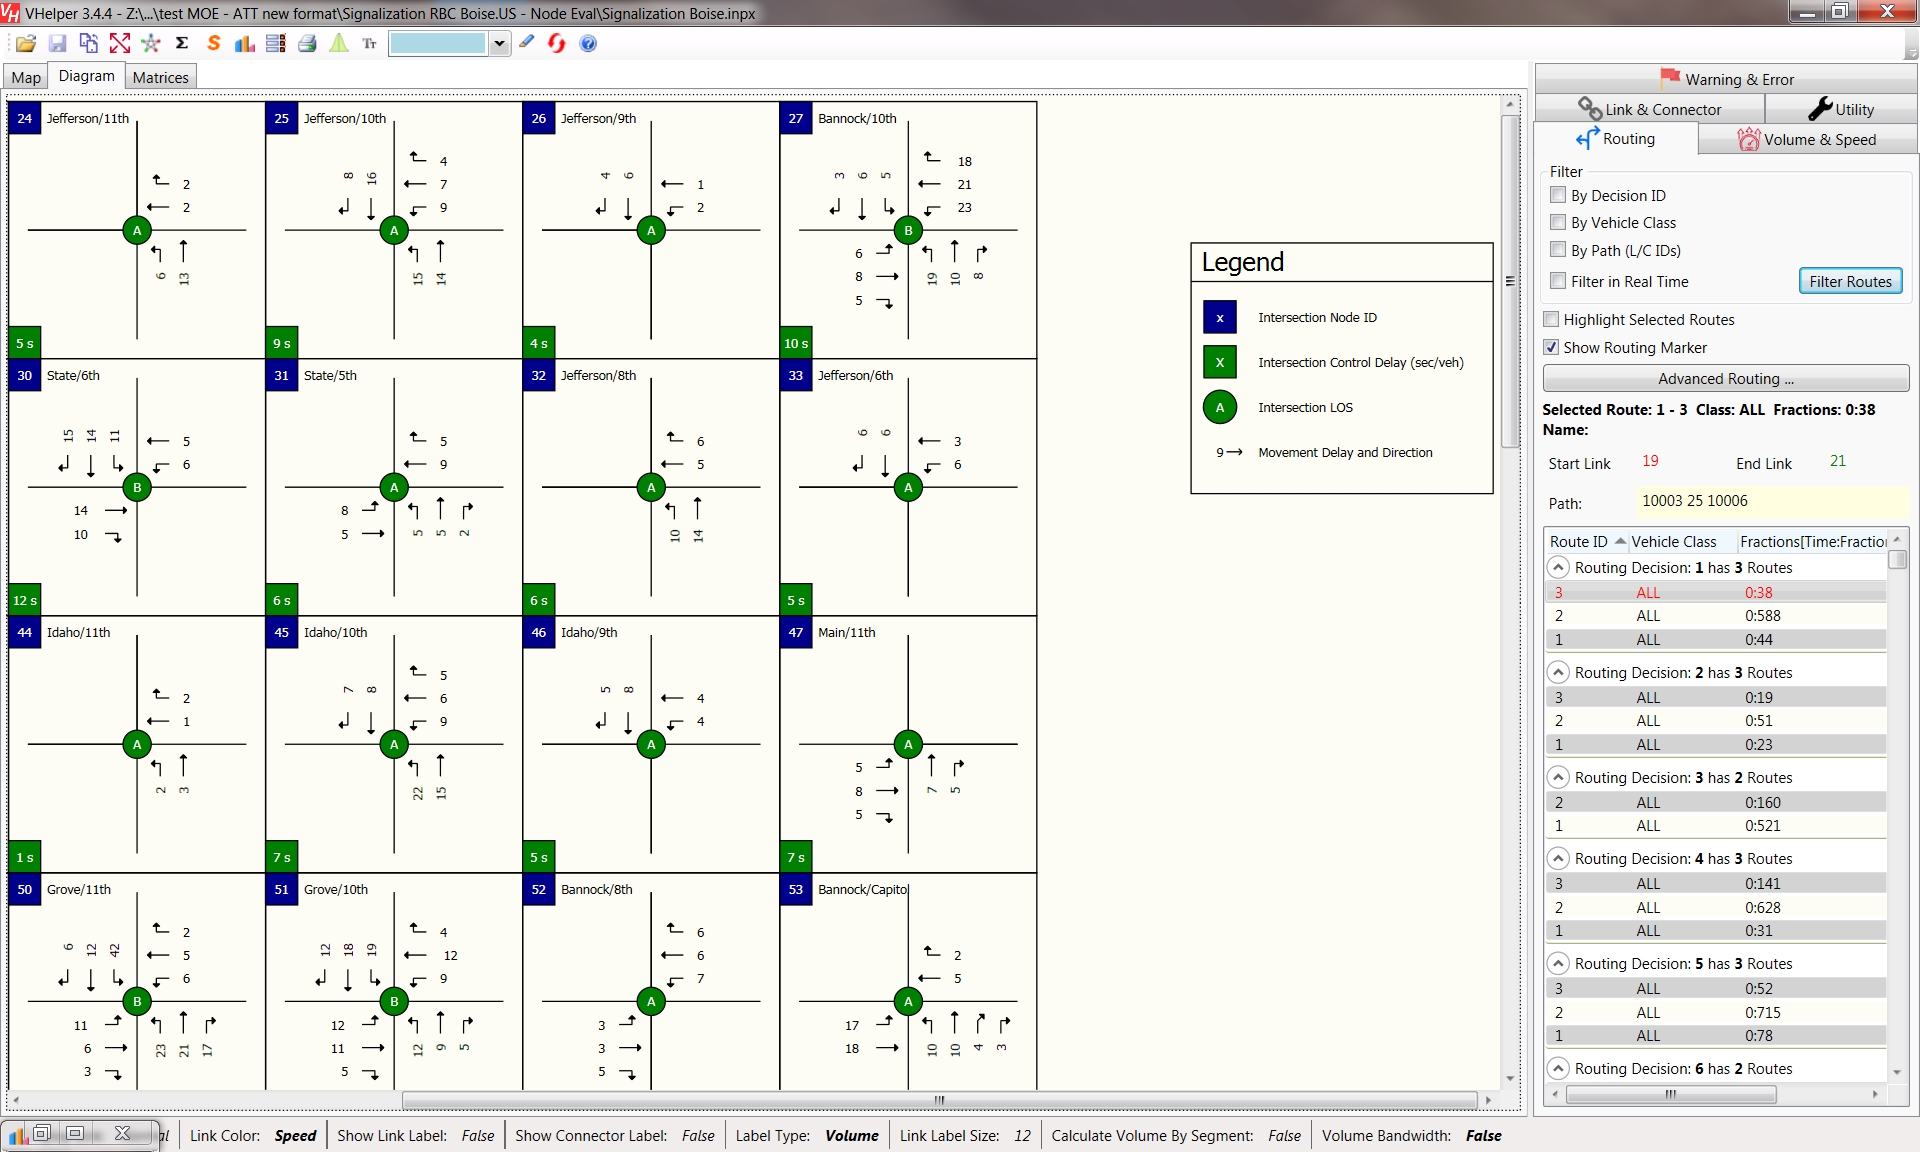
Why not visualizing intersection turn volumes or queues in the map?
VHelper can dramatically reduce your overall project cost by 30% by automating tedious job, catching errors early and providing report-ready visualization.
I only wish I’d known about it (VHelper) years ago
Darrin McKenna, P.E. Vice President, RICONDO
This feature (Combing Routings) has typically been very helpful when dealing with shortly-spaced routing decisions, especially with the post-VISSIM 5.4 lack of an ability to combine routes.
Don't come to me for QA/QC without checking it in VHelper first!
Anthony Gallo, P.E. Kimley-Horn
Such an awesome tool, saved us huge labor and time.
Raj Paradkar, P.E. Senior Transportation Engineer | Project Manager CH2M Hill
Download »Normally it takes a lot for me to gloat about someone else’s product, but I’m really digging the lane change distance error function you built into your program. I just went through the 40 or errors it popped up, and all except two were legitimate. Those two were ones I did on purpose to get the ramp meters to work correctly. Now we won’t have any irregular lane changes in our model. This is a very cool feature, and frankly something VISSIM should add in as part of their “error log”. Thanks again for letting us use this program and I look forward to using it some more
Joshua Johnson, P.E. Senior Traffic Operations Engineer, HDR
Quick Start »Thumbs up.
George Lu, P.E. Senior Traffic Engineer, HNTB
Thanks for providing this useful tool
Jiaxin Tong, P.E. Kimley-Horn
Vhelper looks a great tool!
Wuping Xin, P.E. Chief Technical Officer, KLD Engineering
Contact us »FAQ
2. What Requirements to run it?
Our goal is to make VHelper a companion tool to PTV VISSIM - a great simulation package. Basically VHelper is a VISSIM utility program created by a veteran traffic engineer totally on his own spare time that can be used to increase productivity, for QA/QC and Visualization. It is well acclaimed and receives excellent reviews from our industry VISSIM experts from well-known firms such as CH2M Hill, HNTB and Kimley-Horn.
VHelper provides an easy to use GUI interface for user to zoom and pan the network, it can show network in normal, centerline and lane schematic mode. VHelper calculates the demand volume and desired speed on any link/connector of a VISSIM network with one single click. It can also draw queues by the queue counter MOE output files for visualization
See How To Guide for more information.
2. What requirements do I have to run it?
VHelper® is written in C# .NET and compiled to .NET Framework 4.0 platform. VHelper will be able to run on any Windows machine with Microsoft .NET 4 Run time installed.
By default, Windows 10 or Windows 7 with regular Windows Updates will have .NET 4 or later versions loaded. There is no installation required, just download and unzip, run VHelper.exe
Please Click this link to download and install Microsoft .NET Framework 4 if you don't have it.
- Productivity
- Create Static Routings by Reading OD Matrix text file (Support Multiple Time-Period and Link Specific, such as forbidding GP car to use HOV links)
- Create Vehicle Inputs & Vehicle Compositions from text file (Support Multiple Time-Period as well)
- Combine Static Routings
- Create a series of Data Collection Points along a User Defined Path
- Find & Replace & Filter Routes with a string of Link Connector IDs
- Manipulate Lane Closures along a User Defined Path (a string of Link Connector IDs)
- Visualization
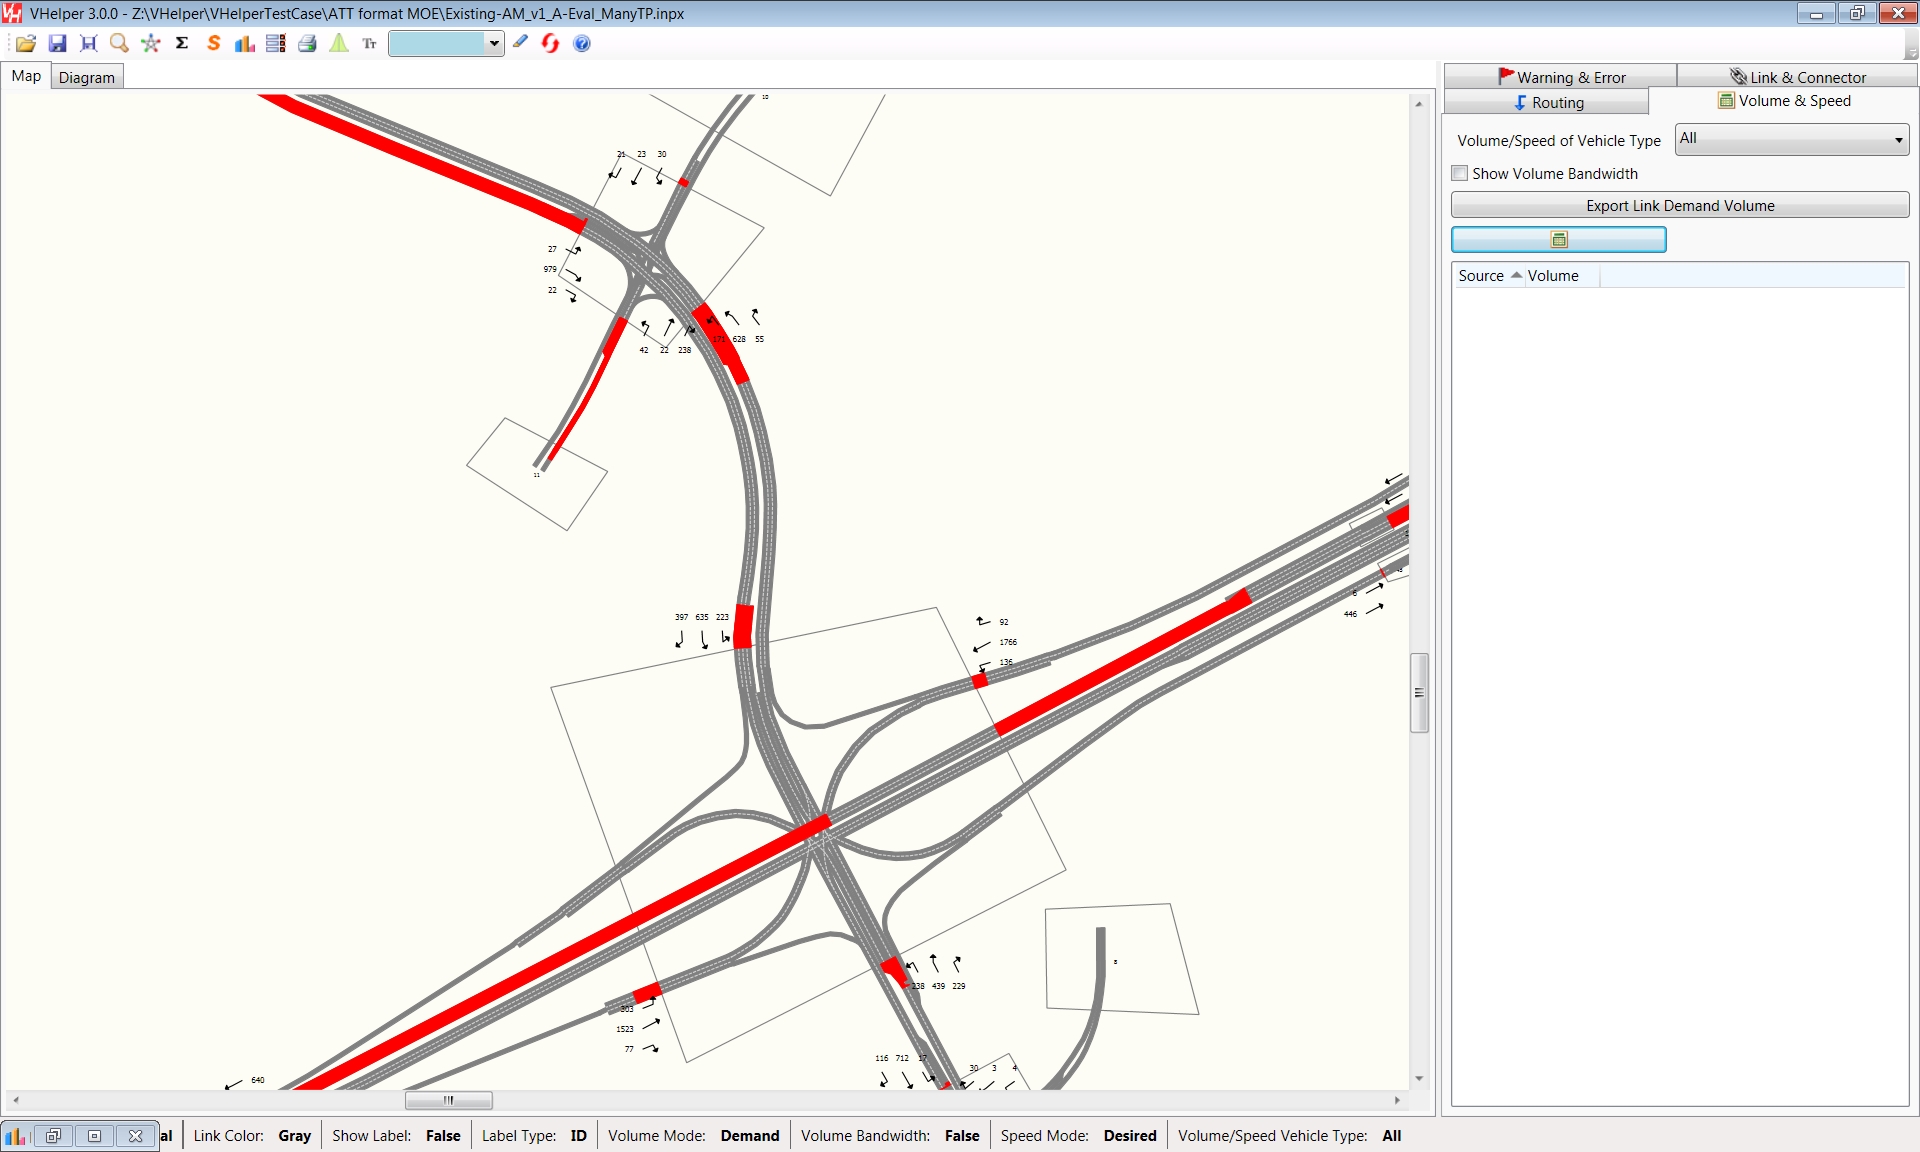
- Calculate Demand Volume by Segment, Label them & Display Volume Bandwidth Map
- Calculate Link Desired Speed & Display in User Specified Color
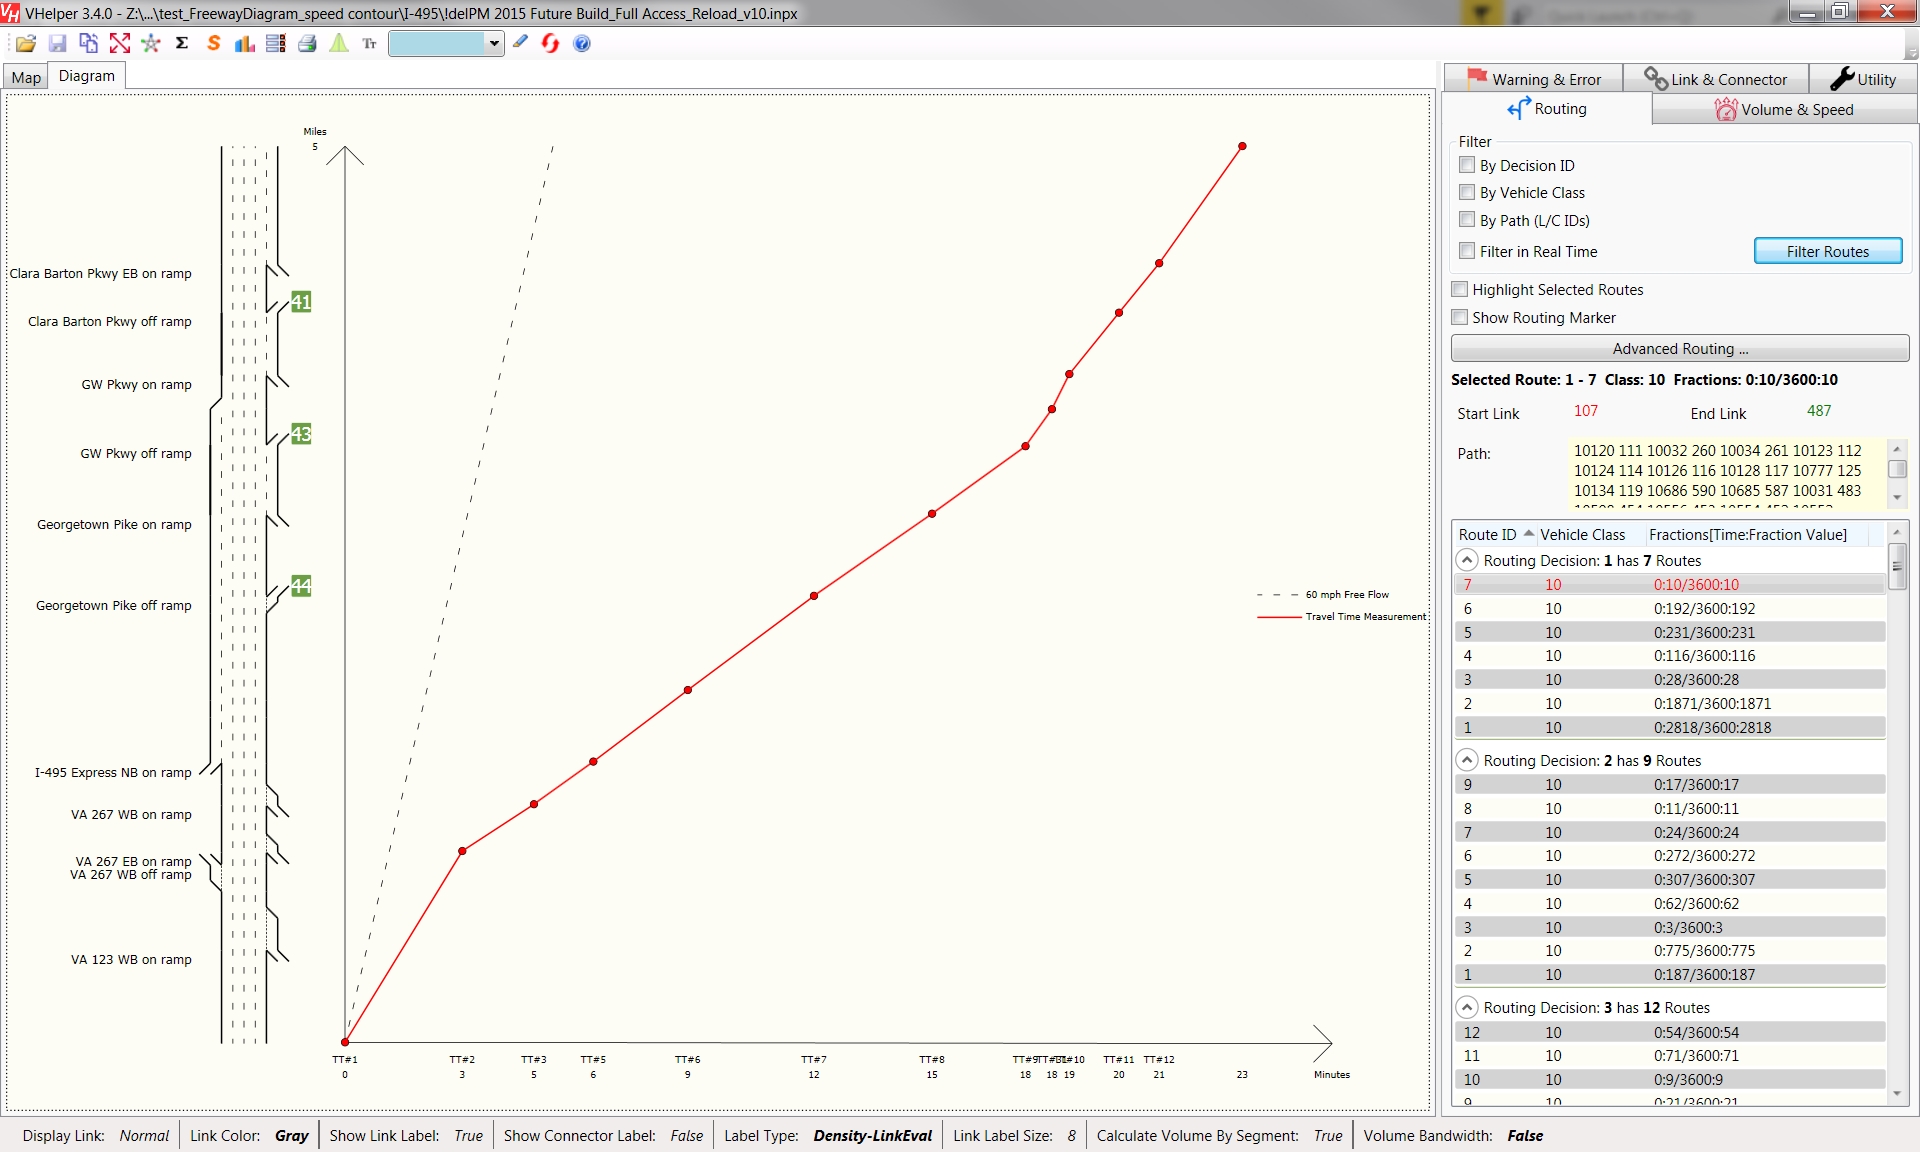
- Visualize Speed Contour Heat Map & Freeway Diagrams from Data Collection Measurement with a few clicks
- Visualize Max/Average Queues from Queue Counter Output
- Visualize Max/Average Queues from Node Evaluation Output files
- Build Node Diagrams - width additional bells and whistles such as Sankey diagram for Volume, Gauge for Delay
- Display Links/Connectors in Centerline, Normal, or Lane Schematic mode
- Display Links/Connectors colors by Link Type, Gray or Speed
- QA/QC
- Check Static Routings by Calculate Demand Volume and Compare against Counts
- Check Desired Speed Decision
- Check Lane Change Distance
- Check Signal Heads Placement